Key Skills Acquired
Command line bioinformatic data processing.
RNAseq data analysis pipeline development.
GO term and KEGG pathway analysis.
RNA extraction and preparation for sequencing.
Data visualization and graphical representation.
Interdisciplinary collaboration and communication.
Introduction
One of the chapters of my dissertation research aims to employ a bioinformatic approach to gain a deeper understanding of how Giardia responds to mucus-like mechanical stresses at the transcriptome level. This involves examining the cellular machinery changes Giardia employs to overcome these mechanical stresses.
RNA Sequencing
I conducted RNA sequencing on Giardia trophozoites under different conditions, each with varying degrees of viscoelasticity. Analyzing the RNAseq data provided valuable insights, forming the basis for the third chapter of my dissertation and a draft journal article.
Bioinformatics Skills and Tools
Beyond the findings related to my research questions, the experience of using command line tools, Google HPC, and programming languages to analyze, manage, and manipulate biological big data was mesmerizing. I fell in love with the process of analyzing big data, experimenting with code, and quickly obtaining results. The abundance of online resources allowed me to continuously learn new techniques, analysis methods, and gain a deeper understanding of bioinformatics.
Continuous Learning and Adaptation
Every research has different experimental plans and model organisms, I often had to search for new analysis and statistical methods, adapting pipelines and techniques. This constant need for innovation kept me motivated and engaged, ensuring I never felt bored! I love this feeling!
Data Visualization
In addition to command line tools for data transfer and automation, I further enhanced my data visualization skills. I am keen on finding the most effective graphical representations for my results, ensuring they are color blindness friendly and publication ready. Below are examples of 3D graphs, contour maps, and heatmaps I created to represent data involving multiple variables:
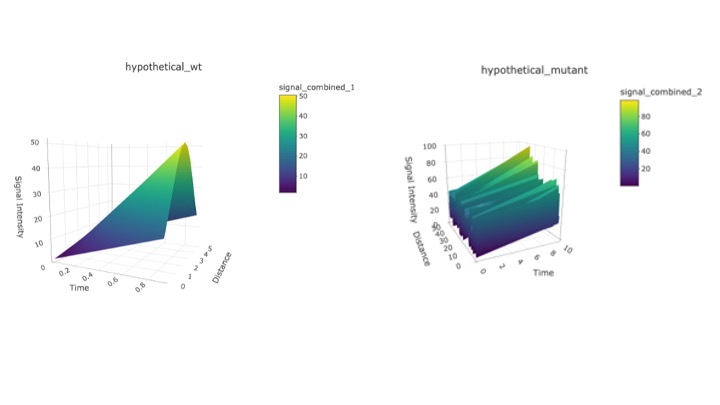
Figure 1: 3D plots created using R for data with three important variables.
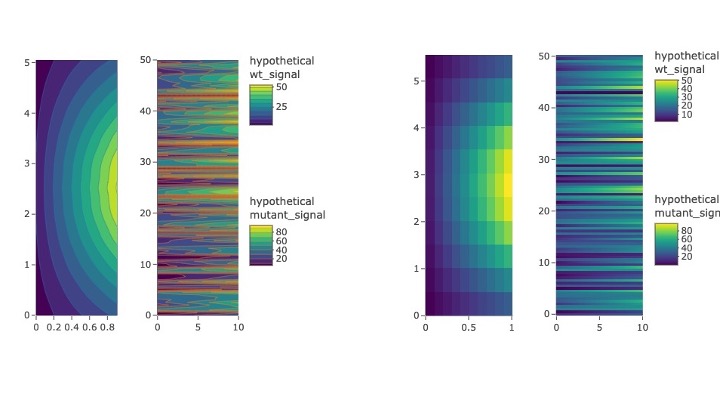
Figure 2: Contour and heatmaps, useful for revealing general trends and distributions in big data.
Principal Component Analysis and Other Visualizations
Here is an example of Principal Component Plots, which help discover data clustering in up to ten dimensions:
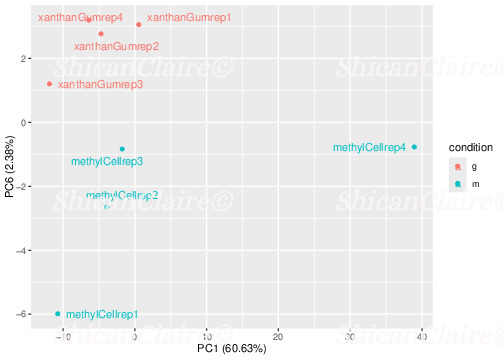
Figure 3: Sample Principal Component Plots showing loose data clustering on the first and sixth components.
Additionally, here is an example of volcano plot, revealing differentially expressed genes:
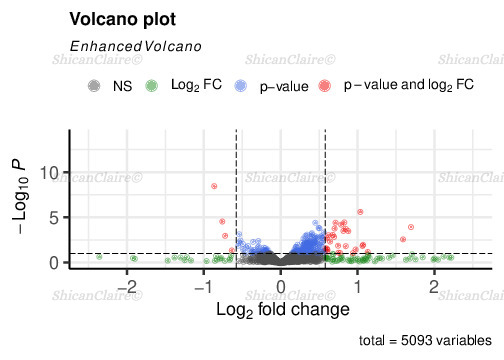
Figure 4: Volcano plot showing differentially expressed genes.
And here is a heatmap from one of my experiments, displaying RNAseq data of cells in three different conditions:
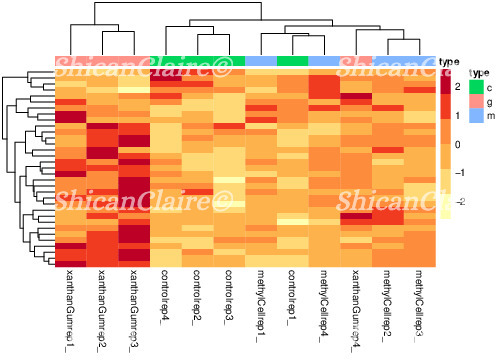
Figure 5: Sample heatmap showing RNAseq data of cells under three conditions.
Bioinformatics Pipelines and Codes
The bioinformatic pipelines and codes I developed or adapted for my research are available in my GitHub repository.
Image and plot examples are original. The publication is currently under review.