Key Skills Acquired
Culturing and maintaining mammalian and motile protozoan cell lines.
Protein purification, Western blotting, and immunostaining.
Imaging data analysis using R and ImageJ.
GeoSpatial pattern analysis in R for cell attachment patterns.
Statistical methods in R to study spatial distributions.
Introduction
Working with cells has been a essential part of both my Master’s research and my Ph.D. projects. In my Master’s project, I utilized mammalian cell cultures to investigate the mechanisms of small molecule-mediated tagged protein degradation. My Ph.D. research also heavily involves working with cells, this time, motile cells. I study a protozoan parasite called Giardia.
I will discuss my Master’s project on the “Chemical Bio” page. This page focuses on the work from my Ph.D. research, exploring how Giardia responds to physiological-relevant mechanical cues.
Ph.D. Projects
I study Giardia trophozoites in environments with varying viscoelastic properties that mimic their host environments during infection. Details of my research can be found in my dissertation, “Sense and Sense Ability: Giardia in Mucus-Like Viscoelasticity”, which has resulted in two paper drafts—one submitted and another in preparation.
To investigate these motile cells, I developed micro-culture systems that enable systematic imaging of the cultures over a time course of growth. This research involved conducting live cell imaging using advanced techniques, including confocal and spinning disk microscopy.
Figure 1: Confocal image of a _Giardia_ trophozoite in culture.
GeoSpatial Analysis Approach
One of the challenges was to analyze the attachment patterns of Giardia trophozoites. I adopted a method commonly used in GeoSpatial research to analyze point pattern distributions, applying these statistical techniques to study the spatial attachment patterns of the cells.
Data Analysis
One of my key strengths is my willingness to engage with people from different labs and departments, and my adaptability in taking on various roles. For this particular challenge, I was inspired by the methods often used by geo-scientists, which differ significantly from the traditional experimental approaches usually used by biologists. This adaptation led me to teach myself R programming for processing biological images and performing statistical analyses. Here are some examples of the analyses I conducted:
Probability Heatmaps
Using point intensity probability heatmaps, I was able to visualize the attachment patterns, providing insights into cell responses to fluid mechanics. Example plot:
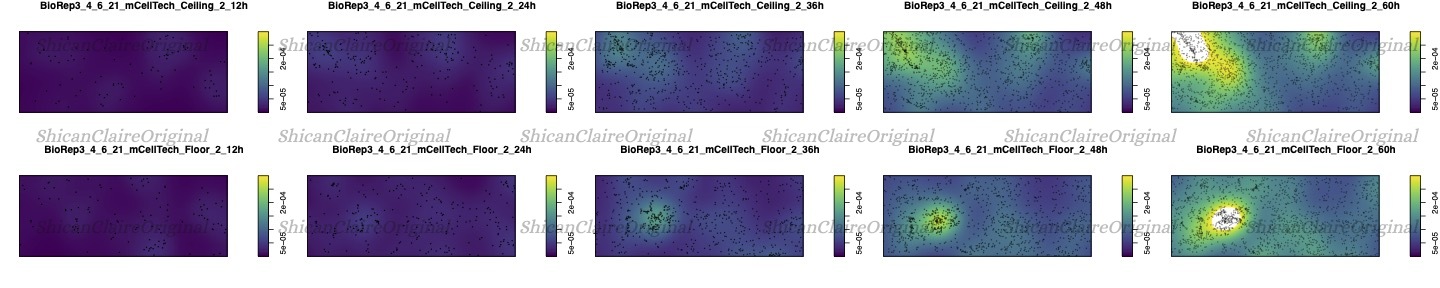
Figure 2: Probability heatmap showing the intensity of cell attachments.
Image Quadrant Analysis and Chi-Square Test
I also performed Chi-Square tests to statistically determine cell distributions. Example:
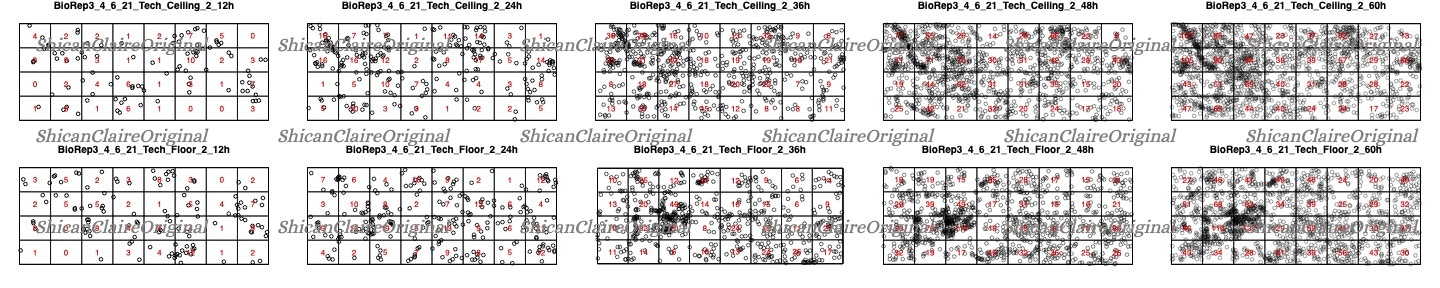
Figure 3: Quadrant analysis of cell distribution with Chi-Square test results.
Fitting Point Patterns to Distribution Functions
Different statistical functions to analyze the significance of pattern differences.
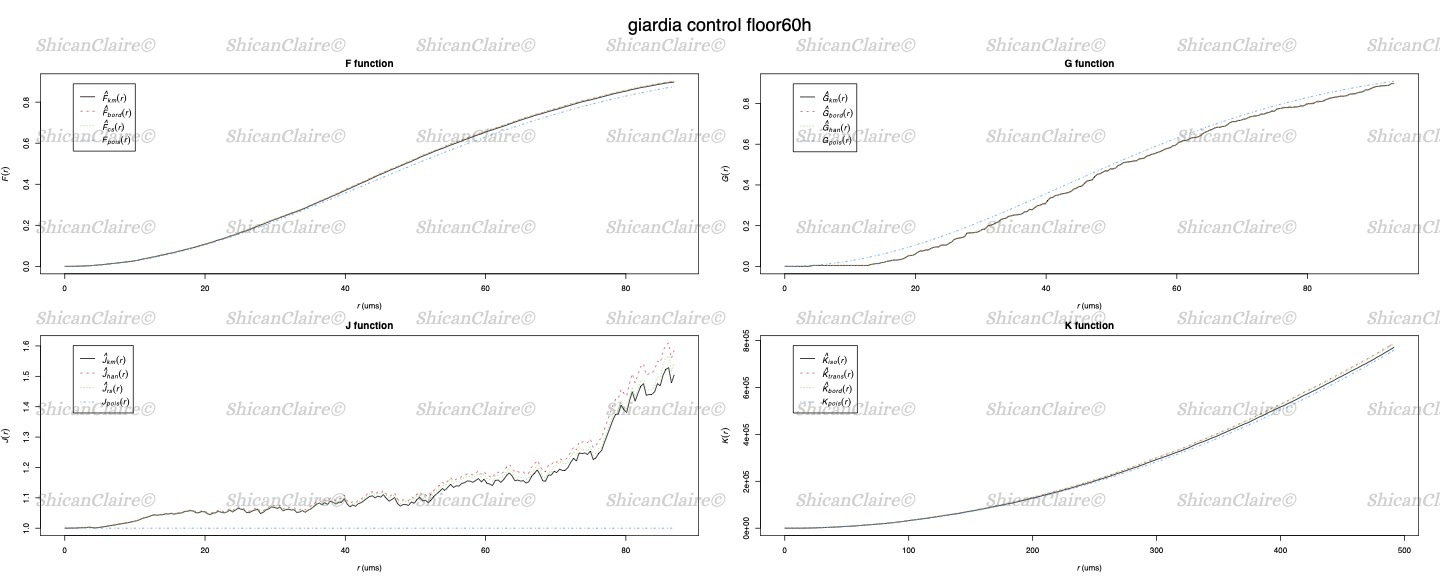
Figure 5: Fitting point patterns to various distribution functions.
Detailed Protocols and Scripts
My detailed scripts are available in my GitHub repository: Explore the GitHub Repository
Image and plot examples are original, the publication is currently in the review process.